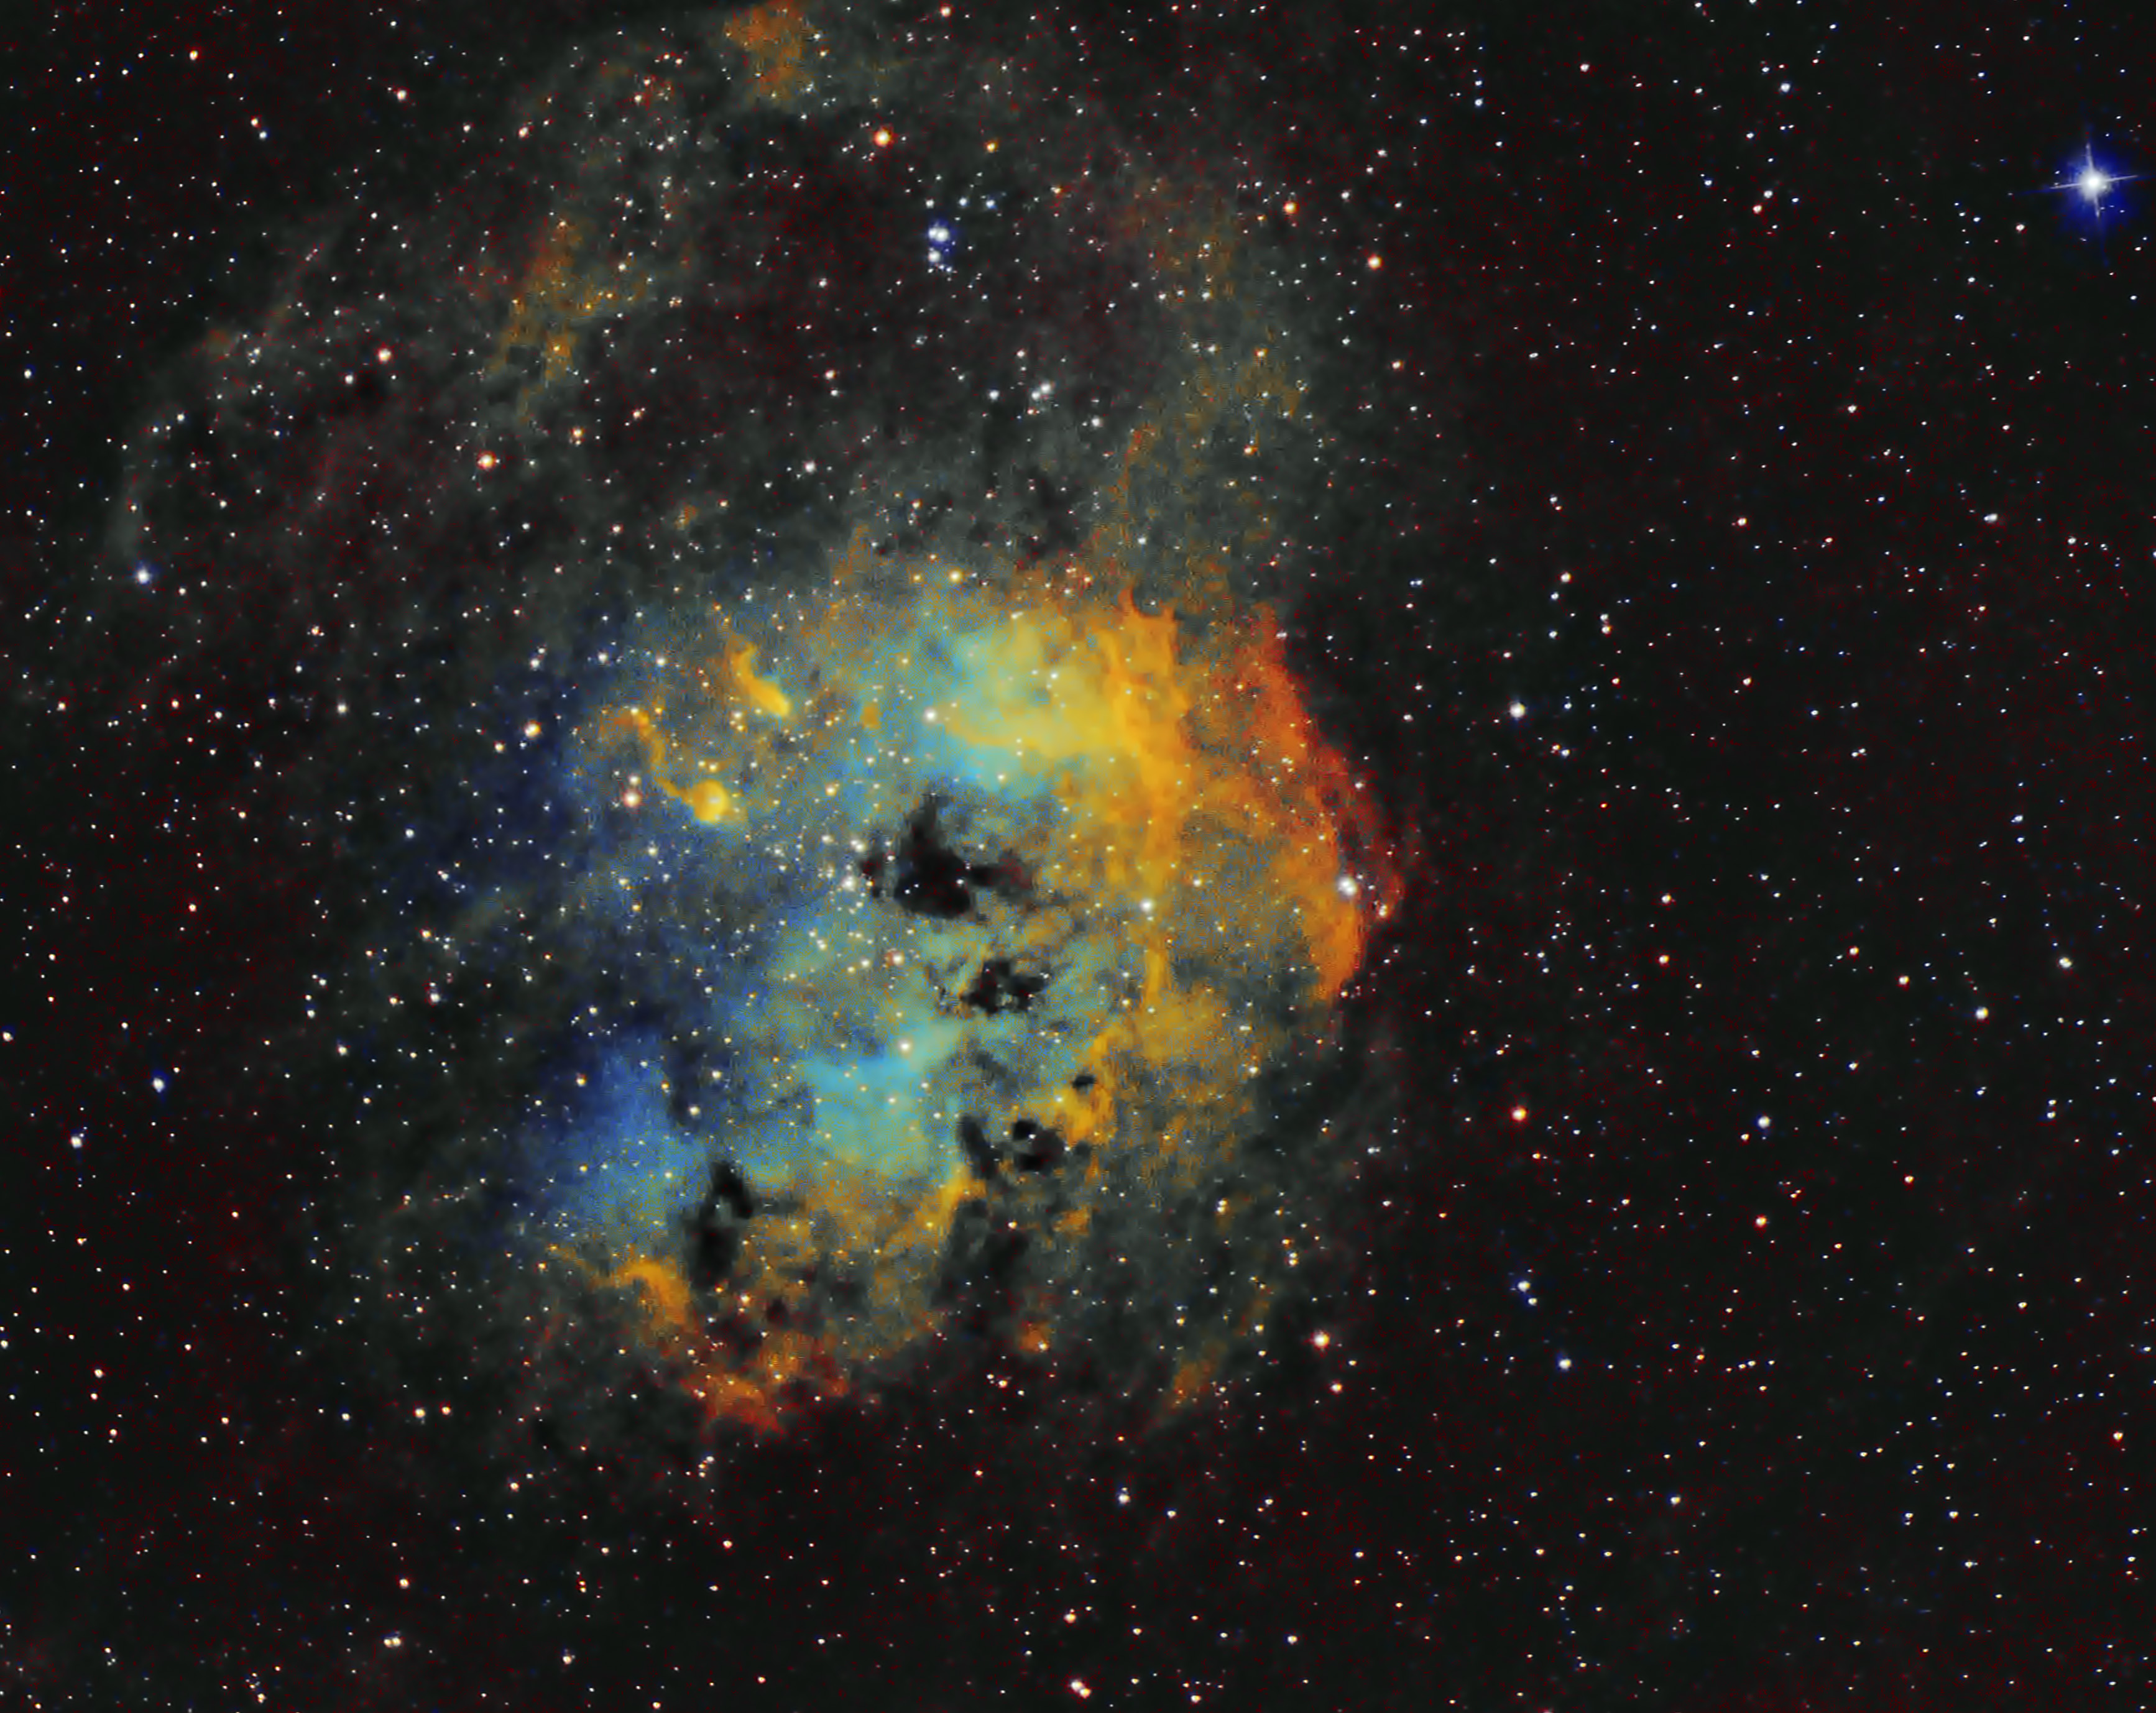
I get asked this question quite often, and usually give a fairly brief summary of the process. Recently I wrote a longer response as a result of bing asked how I got from initial picture to this image of the Tadpoles Nebula IC410:
I used a Skywatcher 130P-DS Newtonian scope which is optimised for imaging, with a matching coma corrector to give sharp round stars across the image. Attached to the scope is an electronic focuser, a filter wheel with eight filters and a cooled mono camera (to give lower noise on very long exposures). There is also a smaller guidescope and camera attached to and roughly aligned with the main scope. This is all mounted on a tracking mount, controlled by a computer that also controls the cameras, filter wheel and focuser. As well as taking photos the computer deals with pointing the mount in the right place. It uses the guidescope and camera to take short (1s) exposures in which it tracks a star and uses this to correct the pointing of the scope in real time, typically with a precision around 1 arc-second.
The larger, cooled, camera is used to take multiple long exposures (typically several minutes, but many factors affect the optimum length, in this case it was mostly two minutes but could usefully have been two or four times as long).
Last year I collected a good set of data using a Hydrogen-alpha (Ha) filter which is a deep red light from ionised hydrogen and usually the strongest signal from nebulas like this. My filter has a 7nm bandwidth, so it suppresses pollution and reduces broadband light sources like stars.
A few nights ago I repeated this with oxygen (Oiii) (a blue-green light) and sulphur (Sii) (an even deeper red) filters.
The images from each layer (typically 20-30) are stacked automatically along with special frames to reduce 'dark noise' and distortions like vignetting (flat frames). As is typical all three layers needed to be 'stretched' (using curves, histogram etc.) to bring out faint details, denoised and given some contrast enhancement or sharpening. Some processes remove the stars then add them back in afterwards to highlight the nebula, but I tend not to use these often.
The Sii signal was very week, and needed a particularly strong stretch, I was surprised that it eventually revealed some quite delicate filamentary structure that sadly don't show strongly in the finished image.
I combined these using the 'Hubble' palette which maps the three layers in wavelength order Sii to red, Ha to yellow and Oii to blue. This starts with Ha mapped to green, but after balancing the image selective colour is used to push the green to yellow. As 0iii is weaker than Ha it often looks very turquoise and is usually shifted to be more blue. The Sii signal gives the Ha signal a browner tinge and can be best seen as a patch to the right of the nebula where the is little Ha.
The actual colour shifts are rather arbitrary as there is no 'scientific' right or wrong for the colour balance. Unstretched images can be used for photometric measurements, but are pretty uninspiring to look at, so just as when you process an earthly image you might choose to alter the saturation for a more pleasing result. In this case the objective is to make the colours reflect the relative distributions of different gasses in the nebula.
I finally improved the smoothness of the image by using the Ha layer as luminance, which remove the noise from the oxygen and sulphur data, but I'm hoping to get more data soon.